Summary
Facilities where more surveyed youth reported fear tended to record slightly more assaults and fights, but knowing a facility’s fear rate told us almost nothing about its recorded incident rate. Youth perceptions and recorded incidents may therefore be most useful when reviewed together rather than treating either measure as a complete picture of safety.
Background
Performance-based Standards, or PbS, organizes youth justice facility improvement into nine areas. One of those areas is safety. A safe facility is not defined only by the number of incidents recorded in its administrative system. It also depends on whether young people feel protected, trust the adults around them and believe harmful situations will be handled fairly.
This study asked whether these two views of safety were connected: when a higher percentage of surveyed youth reported fearing for their safety, did the same facility also record a higher rate of assaults and fights?
The analysis used data from the Center for Improving Youth Justice dataset. It included 85 participating facilities with information collected in April and October 2025. These are two separate points in time. The data can describe differences across the facility observations, but it cannot show whether facilities improved or declined between April and October.
Understanding how the measures relate is relevant to facility improvement. When youth perceptions and recorded incidents point in the same direction, they may reinforce a safety concern. When they point in different directions, the difference may identify an issue worth examining more closely.
Methods
The analysis combined the Youth Climate Survey with Safety 11, an Outcome Measures indicator representing recorded assaults and fights on youth per 100 youth confinement-days. The Youth Climate measure was the percentage of surveyed youth in each facility and collection period who answered “Yes” when asked whether they feared for their safety.
Individual survey responses were combined into one youth fear rate for each facility in each collection period. The two measures were then matched using the facility identifier and collection period.
This produced 162 complete facility snapshots. Seventy-seven facilities contributed observations in both April and October, six appeared only in April and two appeared only in October. This explains why 85 facilities across two periods did not produce 170 observations.
The analysis compared the youth fear rate with the recorded assault-and-fight rate across the 162 snapshots. The observations were colour-coded by collection period so April and October could be distinguished without treating them as a before-and-after comparison.
One important limitation is that facility fear rates were based on between 3 and 111 valid youth responses. A rate based on only a few responses can change substantially because of one additional answer, so results from the smallest response groups require particular caution.
Finding
The youth fear rate provided very little information about differences in recorded assaults and fights. It accounted for only about 1.2% of the differences in Safety 11 results across the facility snapshots.
The observations showed no clear or consistent pattern between youth-reported fear and recorded assault-and-fight rates. Some facility snapshots had high youth fear and few recorded incidents, while others had relatively low fear and higher recorded incident rates.
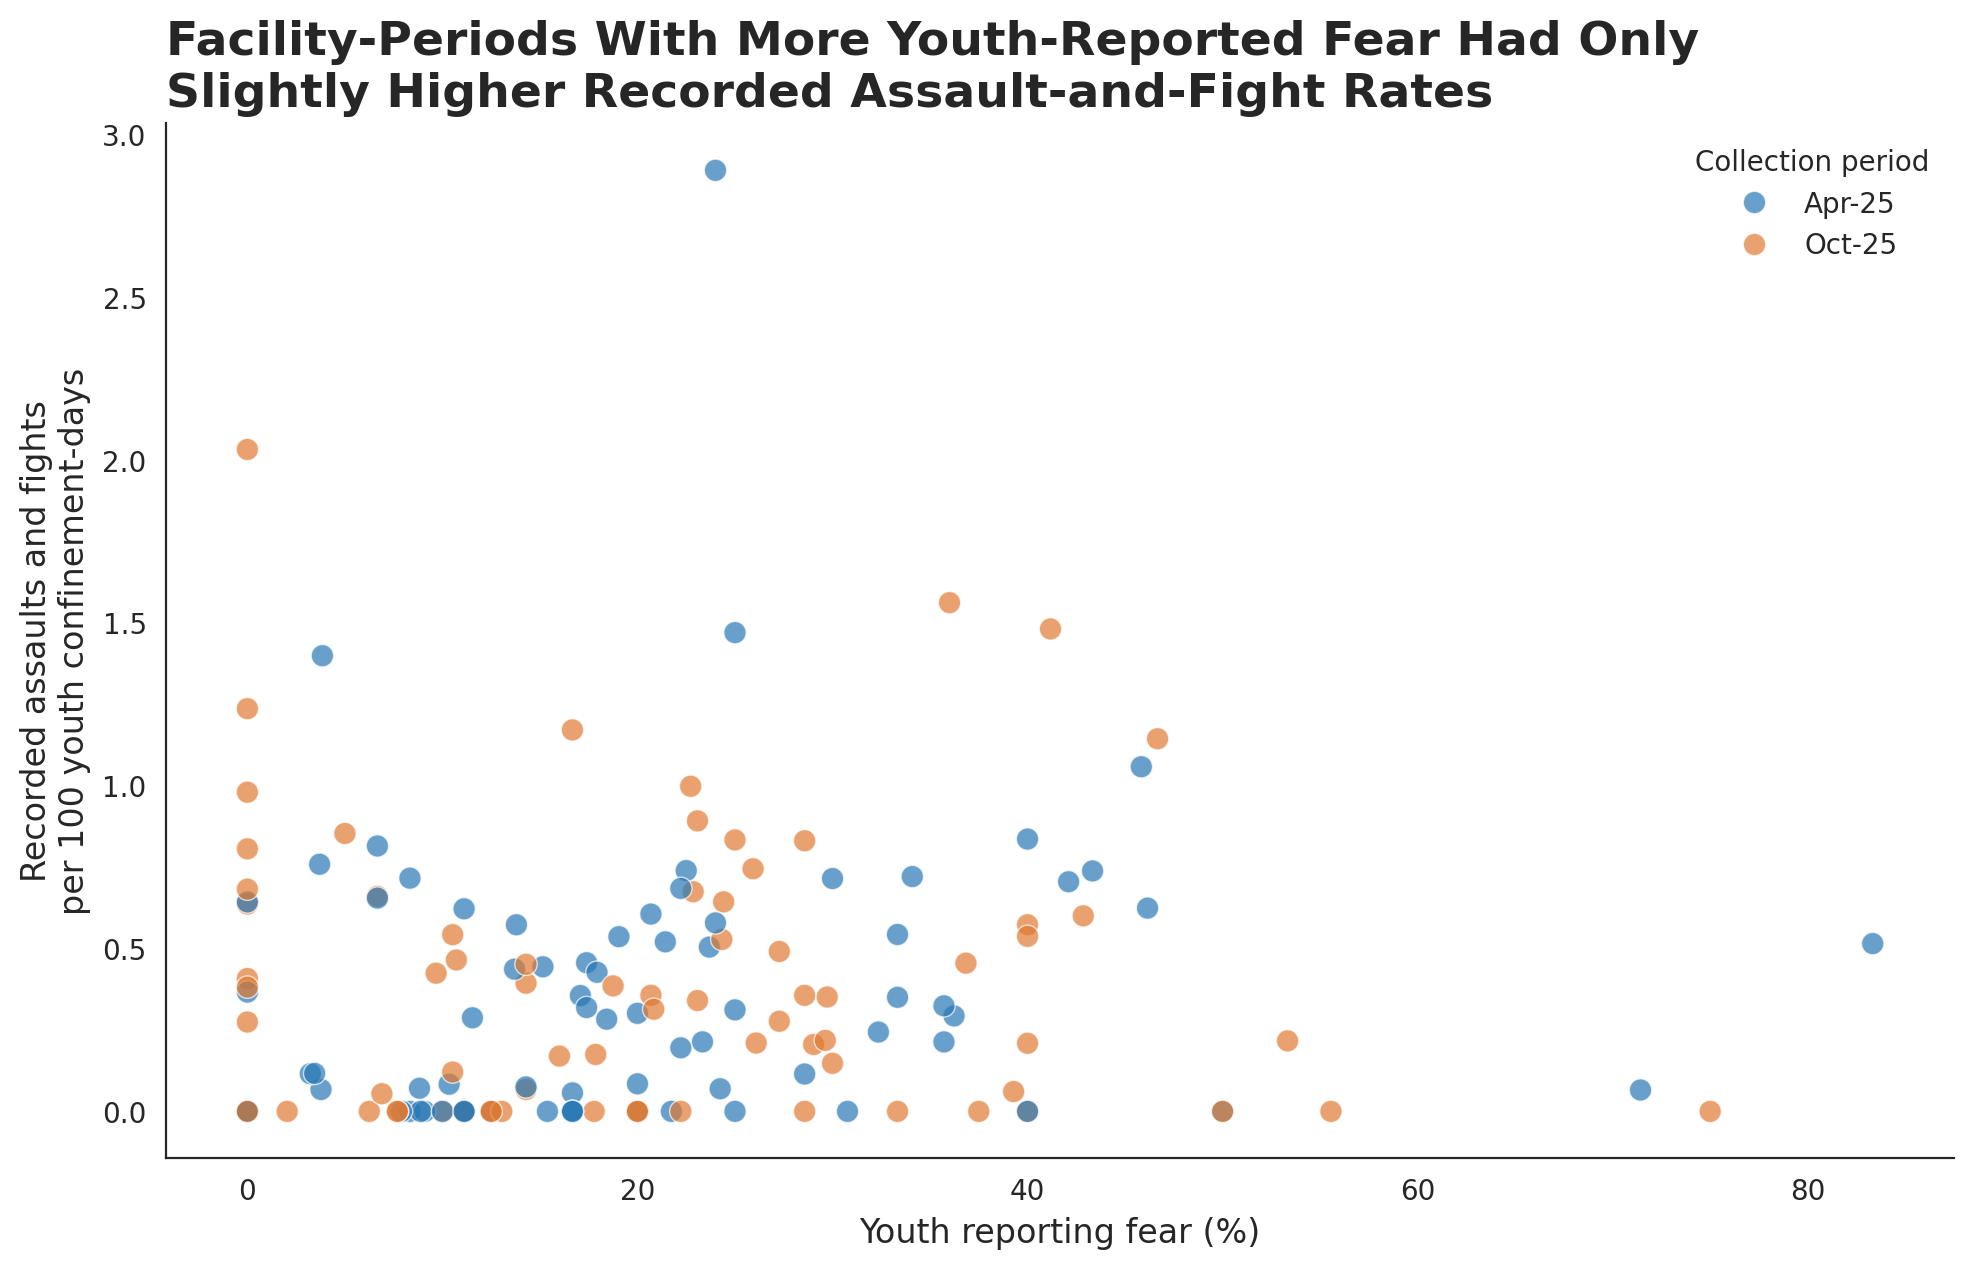
The horizontal position shows the percentage of youth reporting fear, while the vertical position shows the recorded assault-and-fight rate. The wide spread of blue and orange dots shows that the two measures did not move together consistently in either collection period.
April and October observations were combined for this analysis rather than compared as a measure of change. The result therefore does not show whether safety improved or declined between the two periods.
The finding also does not show that fear causes assaults or that assaults cause fear. Other facility conditions—including staffing, crowding, leadership, institutional culture, youth population and reporting practices—could influence both measures. Youth surveys capture personal perceptions, while the administrative measure depends on incidents being recognized, classified and recorded consistently.
Implications
CIYJ coaches and facility directors may want to examine youth-reported fear and recorded incident information together during safety reviews. A low recorded incident rate may not necessarily mean youth feel safe, while a higher recorded rate may sometimes reflect more consistent reporting rather than poorer safety conditions alone.
When the measures point in different directions, that gap is a worthwhile area to examine. Coaches might consider asking whether youth feel comfortable reporting concerns, whether staff apply incident definitions consistently and whether a small survey-response group is giving an unstable picture of the facility.
The finding does not support directing facilities to change a particular policy or programme. Instead, it suggests that safety assessments may be stronger when administrative records are considered alongside youth experiences, facility conditions and conversations with the people who live and work there.